
This article provides a beginner’s guide to master hypothesis testing in statistics. An example is provided to explain how the guide works.
Hypothesis testing is an important factor for predictive modelling in the field of statistics. Hypothesis testing consists of the following important concepts:
- Z-value (Z), a statistical term, which is the measure of the standard deviation from the mean value, resulting in the computation of the observed value.
- P-value, another statistical term associated with the standard normal distribution.
- Z-table, which shows each P-value associated with each Z-value.
- Central limit theorem, which is an important theorem in statistics. This theorem states that the mean distribution of the sample size must be normal irrespective of the distribution of the population.
- Significance level, also called as the alpha level, denotes the accepted cut-off level. In general, a significance level of 5% is acceptable in statistical terms. If the computed probability is lesser than the significance level, it can be concluded that there is no difference between the sample population and the total population size.
Example
For obese patients, the blood-glucose levels are at a mean ( ) of 100 with a standard deviation ( ) of 15. Research has suggested that diet rich in raw corn-starch can raise the glucose levels. A sample size ( ) of 36 patients who were tried with this diet did have an improved glucose level of 108 ( ). Perform a hypothesis test on whether raw corn-starch is beneficial.
Guide to performing hypothesis testing
- Determine the type of hypothesis testing (Null or Alternate). For this example, let us choose Null hypothesis.
- State the hypothesis for the above example. The population mean is 100.
- Set up the significance level. As it is not mentioned for this example, assume it to be 5% (or 0.05).
- Calculate the random chance probability, using the following formula:
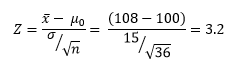 The P-value associated with the Z-value of 3.2 is 0.9993. This means that the probability of having a value less than 108 is 0.9993, while the probability of having a value equal to (or more than) 108 is (1-0.9993), which is equal to 0.0007.
- As the computed value of 0.0007 is less than the significance level of 0.05, the Null hypothesis test to determine the raw corn-starch effect can be rejected.
Reference
Vidhya, A. (n.d.). Your Guide to Master Hypothesis Testing in Statistics. Retrieved from https://www.analyticsvidhya.com: https://www.analyticsvidhya.com/blog/2015/09/hypothesis-testing-explained/