
Market research is a dominant component of research in the industry. A key aspect of this research is the ability to understand the opinion of the respondents toward a brand, feature, product, service, or anything else. When a researcher measures the opinions of the respondents, he is also able to analyze and measure the level of changes that are required. The Likert scale is a widely used quantitative data collection tool that is used in the research process. It allowed researchers to understand and quantify the sentiments of the respondents. Most of the research that is taken up by brands can make timely and relevant changes because of being able to quantify emotion or sentiment.
Let us first understand what is Likert Scale
A Likert scale is a unidimensional scale that is used by researchers to collect data about the opinions and attitudes of the respondents. The psychometric scale was often used by researchers to get a hang of the views and perspectives of a brand, its product, or its target market.
There are many scales that are available which are directly focused on measuring the opinion of the people. Some of them are Guttman Scale, Bogardus Scale, and Thurstone Scale.
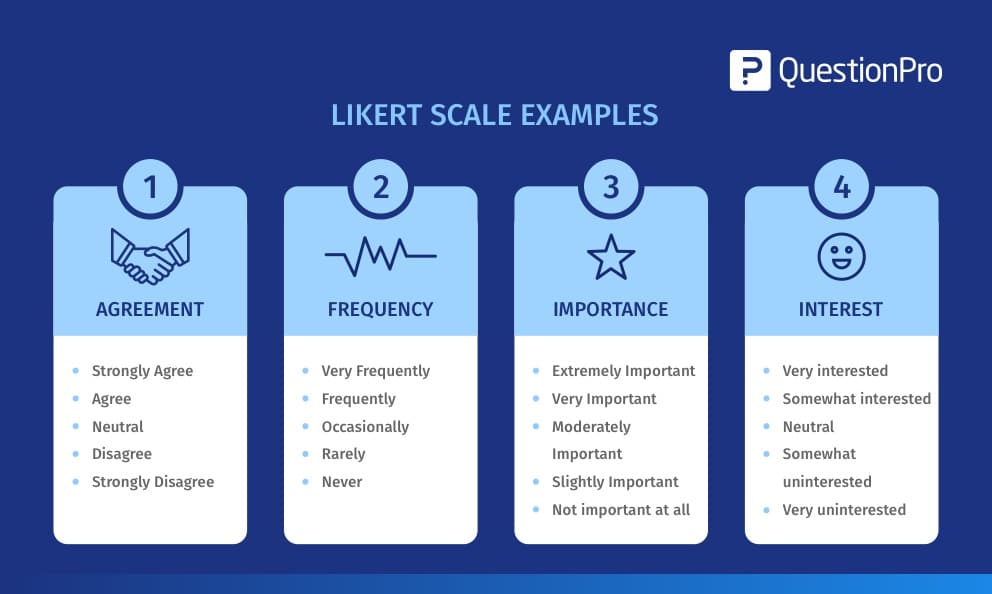
Example of a Likert Scale:
A researcher can apply the Likert scale question to get a response on the feedback of a product as a dichotomous option. The researcher will frame the question as a statement and not in question firm, such as:” The quality of the product was satisfactory”. The options listed will agree or disagree. Another way to frame the same statement or question would be, “Mark your level of satisfaction with the quality of the product.” the options given to the respondents can range from dissatisfied to satisfied.
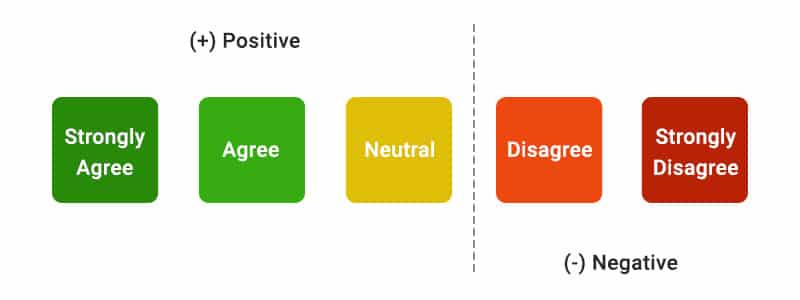
As a respondent to a question like this, the response will be based explicitly on the agreement or disagreement level and the Likert scale creates the scope for determining the agreement or disagreement of the respondents. The main assumption of the Likert scale is that the strength and the intensity of the experiences are Linear in nature. Hence, it stretches from a complete agreement to a complete disagreement, with an assumption that attitudes can be measured.
Variations in Likert Scale
In the field of research, the Likert scale is the most preferred scale used for research related to market study where the responses of the customer have to be collected to assess their satisfaction level, preferences, experiences, etc. The Likert scale can be divided into two major types.
- Even Likert Scale
- Odd Likert Scale
- Even Likert Scale: The even Likert scale is used when researchers want to collect extreme opinions or feedback from the respondents and not give them any neutral opinions.
- Four-point Likert Scale: In this kind of Likert scale, researchers use four extreme options and do not offer any neutral choice to the respondents. Here the various degrees of importance are represented in a four-point Likert scale so it is also called as Four Point Likert Scale of importance.
- Eight of recommendation: This is a slight variation of the point Likert Scale: This is also called an eight-point likelihood. This is a slight variation from the four-point Likert scale, where the prominent difference is that the scale has eight options to collect feedback about the likelihood of a recommendation.
- Odd Likert Scale: The odd Likert Scale is used when the researchers want to give the respondents the option of a neutral response. The variations in this type of Likert scale are
- Five Point Likert Scale: with five answer options, researchers use this to gather information about a topic where a neutral response also has relevance or where there may be a possibility that the respondent does not want to answer from the extreme choices given and may want to opt for a neutral response.
- Seven-point Likert Scale: This option adds two more answer options at the extreme ends of the 5-point Likert Scale Question
- Nine-Point Likert Scale: This kind of Likert scale is not seen much in use and because of the complexity attached to its application, it’s not a preferred option by researchers. It adds two more extreme end options to choose from for the respondent.
Characteristics of the Likert Scale:
The Likert Scale came into existence in the year 1932 and was first used as a five Point Likert Scale, which is extensively in use even today. These scales range from a group of general topics to more specific ones which can ask respondents on varied topics, ranging from their level of agreement, approval, or belief. Some of the prominent traits or characteristics of the Likert scale are explained here
- Related Answers: Items should be easily related to the sentence’s answers, regardless of whether the relationship between the item and sentence is evident.
- Scale Type: There should always be two extreme positions in the items and a middle option which can also be called an intermediate answer which serves as a stepping stone or graduation between the two extremes.
- The number of options: as stated above, the most common type has been the five-point Likert scale, however as the points are increased from 5 to 7 or 9, the precision in the results also increases. Though this may make the analysis a more complex task to perform the accuracy of the output goes up.
- Building up the reliability of the scale: Researchers often elongate the ends of the scales and create a seven-point scale. They add a “very” to each of the ends of the scale, that is the top or the bottom. The sever point scale is at the upper limit of the reliability of the scale.
- Using wide scales: A most common rule recommended by Likert and others is also that, it is better to use a scale that is as wide as possible. At the time of analysis, if required the answers can be collapsed into smaller groups if required.
- Removing the Neutral response option: a lot of researchers curtail their scale to an even scale and get away with the neutral possibility. This makes the survey a forced choice survey where the respondent has no choice but to go with one of the extremes as an answer to the statement.
- Presence of an intrinsic variable: The application of the Likert scale states that there could be an inherent variable whose values impact the responses or choices made by the respondents in the context of feedback or attitude. This underlying variable is the interval level, best.
Analysis of Likert Scale Data:
Surveys are a common practice with researchers to measure and analyze the quality of products and services. It is a standard classification format for studies. The respondents offer their opinion which is also what makes the data about the quality of a product or service from high to low or better to worse by using points that range from four to nine, depending upon the choice of the researcher taking into consideration various factors. Researchers and auditors generally group collected data into a hierarchy of four fundamental measurement levels – nominal, ordinal, interval, and ratio measurement levels for further analysis:
- Nominal Data: This is the kind of data in which the answers when classified into variables will not have quantitative data or a quantifiable order.
- Ordinal Data: this kind of data is possible to be classified or sorted but the measurement of the distance between is impossible to do.
- Interval data: Interval data is data in which the measurements of the orders and distance are possible to be done.
- Ratio Data: this kind of data is quite like interval data. The only difference here is that ratio data has an equal and definite ratio between each data and absolute “zero” is treated as a point of origin.
Data analysis with any of the above four data is straightforward and transparent. The ordinal data analyses, particularly in regards to Likert Scale analyze the data in a more effective manner. This is not a new concern in the field of research. The effectiveness of handling ordinal data as interval data continues to be debatable in survey analysis of various applied fields.
A few critical points of consideration here are:
- Statistical Tests: a lot of time researchers treat ordinal data as interval data because it is claimed and preferred that parametric statistical tests are far more powerful than their non-parametric alternatives. To add to it, the inferences that are drawn from parametric tests are easier to interpret and give out more information as compared to their non-parametric counterparts.
- Focus on the Likert Scale: By just treating ordinal data as interval data, nothing much will be achieved unless the values are examined of the data. Otherwise, the objectives of the analysis can be misled and it can misrepresent the output of the survey. In order to analyze scalar data in a better way, researchers surely consider ordinal data as interval data but also at the same time concentrate on the Likert scale.
- Checking median or range: the universal guidelines indicate that the mean and standard deviations are not the correct parameters and they are baseless for detailed statistics when the data is on an ordinal scale. This is true for any parametric scale that is based on the normal distribution. The non-parametric is done based on the right median or the range for data inspection.
- The useful techniques for data analysis: The Likert scale data has the typical characteristics of being discrete, ordinal, and limited in scope. For a long, there has been a debate and even dispute over the most appropriate way to analyze this data. The first option to be considered is between parametric and non-parametric tests. Let us understand the difference between the use of either of these two tests,
- Parametric tests assume a regular and uninterrupted division
- Non-parametric tests do not assume an uninterrupted division. But there is a possibility of concerns about a lesser ability to detect a difference when one of them exists.
Which of these is a better choice to make? Well, the final decision rests in the hands of the researcher and the kind of results that he wants from his study.
Advantages and Disadvantages of the application of the Likert Scale:
The biggest advantage of the Likert Scale is that it is the most universal method for survey collection, therefore they are easy to understand and comprehend. The responses of the Likert scale are easily quantifiable and subjective to the computation of some mathematical analysis. This kind of questionnaire refrains from imposing the respondent to give a simple and concrete yes or no answer and thus does not force him to take a stand on the given statement, especially when the respondent is in any kind of dilemma. It offers the freedom to the respondent to respond in a degree of agreement and this offloads the respondent and puts him in an easier and more comfortable zone. In addition, the Likert scale also creates the scope to accommodate the neutral or undecided feelings of the participants. At the time of coding the responses, the Likert scale responses are the easiest to code as a single number represents the participant’s response. Over and above the mentioned advantages of the Likert scale in usage and analysis for both the researcher as well as the respondent, these scales are inexpensive, quick, and efficient for data collection. They can be used in a versatile manner and circulated over the internet, given in person, or even sent out by mail for ease with which the respondent can comprehend and respond.
There are a few disadvantages of this technique, Likert Scale is uni-dimensional in nature and whereas the attitudes of the population for one item in its truest nature exists in a vast and multi-dimensional continuum. The space between the four to nine choices that the Likert scale offers to its respondents cannot be equidistant, as assumed and therefore it fails to measure the accurate attitude of the respondents. In the pattern of a Likert scale questionnaire, the choices of the people are influenced by the previous questions and another big challenge or drawback of this technique is that respondents prefer to go for neutral responses for fear of getting labeled as extremists even though the extreme choices may be more accurate responses. This can impact the authenticity as well as the accuracy of the results.
- it is not unlikely that peoples’ answers will be influenced by previous questions, or will heavily concentrate on one response side (agree/disagree). Frequently, people avoid choosing the “extreme” options on the scale, because of the negative implications involved with “extremists”, even if an extreme choice would be the most accurate.