
Statistical test can be complex but it verifies & assures the quality of the study. In analytical work, the most crucial task is the comparison of data (sets of data) and making interpretations.
Inferential statistics, one among the two major branches of statistics, are concerned with making inferences based on the relationships found in the sample, to that in the population. This kind of statistics back the hypothesis, and such inferential test that supports the existence of group differences in the entire population is the Chi-Square test.
The Chi-Square test assumes (the null hypothesis) that the observed values match the expected values for categorical data. Chi-Square test is of two types,
- Chi-Square goodness-of-fit test – This test is performed for one categorical value and begins with hypothesizing that variable distribution behaves in a specific manner. For example, in order to identify the daily staffing needs of a store, the manager would wish to know if there is any consistency in the number of customers throughout the week.
- Chi-Square test for independence – This test is conducted for two categorical values. It compares variables in a contingency table & investigates if they are related. However, if the observed data doesn’t fit the model, the likelihood that the variables are dependent enhances, proving that the null hypothesis is incorrect.
For instance, this test can help us determine if the DRE is independent of biopsy results.
Chi-Square goodness-of-fit and test for independence depends only on the degrees of freedom and set of observed and expected values. These tests do not require any assumption pertaining to distribution of the parent population. However, if the test is performed along with the standard approximation, the applicability of Chi-Squared distribution, assumptions such as,
- Simple random sample – It is a random sampling from a fixed population where every individual of the distribution/population of sample size has an equal probability of selection.
- Constraints on cell frequency must be linear – If a sample with a large size is assumed, but the test is performed on smaller sample size, then the test will yield an inaccurate inference.
- Theoretical cell frequency must be greater than 5 – As a rule of thumb, the expected cell count of a 2-by-2 table must be 5 or more and, for larger tables, it must be 5 or 80% of the cells.
- Independence of observations – The observations must be independent of each other, which implies that Chi-Square cannot test correlated data such as matched pairs.
Chi-Square statistics
Chi-Square test includes calculating a metric known as Chi-square statistic and the formula used here is,
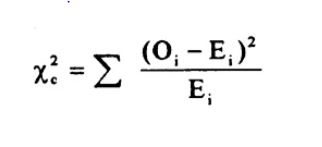
Where, E=(row total×column total) / sample size
Here the subscript ‘c’ indicates degrees of freedom, ‘O’ is the observed value and ‘E’ is the expected value. The summation indicates that the calculation must be done for each data item in the given data set.
Note that the Chi-square statistic cannot be used for percentages, proportions, and be used only on numbers.
For example, if you have 5% of 100 people, you must first convert 5% into the whole number and then run the test.
Chi-Square statistic includes variations which utilise the same concept, i.e., comparing observed & expected values. However, the type of variations used depends on how the data was collected and the hypothesis is being tested.
One of the most common forms of variation used for contingency tables is
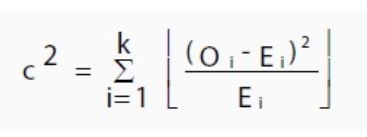
Where E is the expected value, O is the observed value, and “i” is the ith position in the contingency table.
How to determine the statistical significance
The low value for Chi-Square implies that the correlation between the two sets of data is high. Theoretically, if the observed & expected values are equal, then Chi-Square would be zero, which is practically impossible.
Determining if the test statistic is large enough to specify a statistically significant difference, includes two processes.
- Comparing calculated Chi-Square value and critical value from Chi-Square table. If the Chi-Square value is smaller than that of the critical value, there is no significant difference.
- Utilising P-value.
To calculate P-value manually,
- Firstly, determine the observed & expected values.
- This is followed by calculating the degrees of freedom using the formula,
Degrees of freedom = n-1, where ‘n’ is the number of variables.
- Compare observed & expected results with Chi-Square value (using the formula mentioned above).
- Choose a significance level (in decimals). Most commonly used value is P=0.05.
- Use Chi-Square distribution tables and approximate P value.
- Determine whether to reject the null hypothesis or not.
Example of Chi-Square test
Consider a random poll was conducted across 1000 voters (both male & female). The individuals who were classified based on their gender and whether they were supporters of party A, B or C.
| Party A | Party B | Party C | Total | |
| Male | 150 | 200 | 50 | 400 |
| Female | 270 | 300 | 30 | 600 |
| Total | 420 | 500 | 80 | 1000 |
- Calculate the expected value (E) using the above-mentioned formula
- In the second step, calculate the Chi-Square statistic
- Sum up all the values of Chi-Square statistics results, identify P-value and determine if the result is statistically significant or not
After obtaining the significant result, you can perform follow-up tests such as post-hoc test, to pinpoint the reasons for the significant result. To know more about it, visit https://www.rforge.net/doc/packages/NCStats/chisqPostHoc.html.