
Do you want to know how to save 90% of your time on formatting the SPSS tables?
Well, it’s quite simple.
All you have to do is to make minor modifications to the SPSS settings and you’re done. Yes, it is that simple.
As you know the conversion from SPSS to Microsoft word format is frustrated and tedious but the pain can be reduced if your entire manuscript contains tables which is of course not possible.

-
- Create the variable and Input data:
The first step in making the adjustment to the SPSS involves creating the variable and inputting the data.
For creating the variable:
-
-
- Open the SPSS statistics data editor.
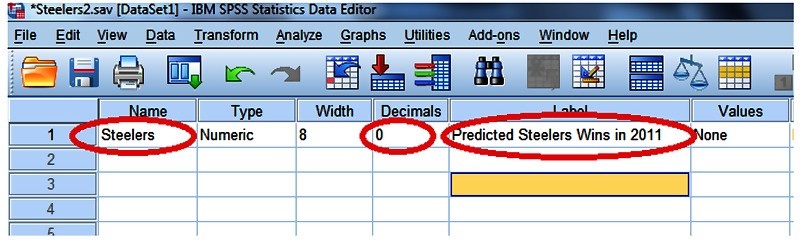
- Create a new variable under the variable view and do the following:
- Give a name to the variable.
- Set decimal to zero
- Give a label to the variable.
- Enter the values for the variable in the ‘Data View’ tab.
-
- Creating a custom table for editing:
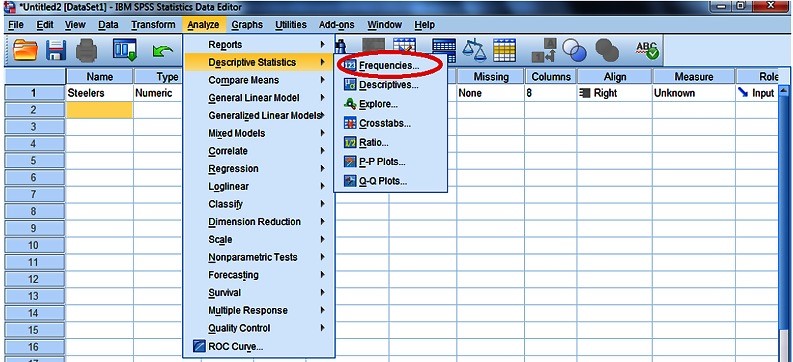
The second step involves producing an initial table for editing.- Go to ‘Analyze’> ‘Descriptives’ > ‘frequencies’
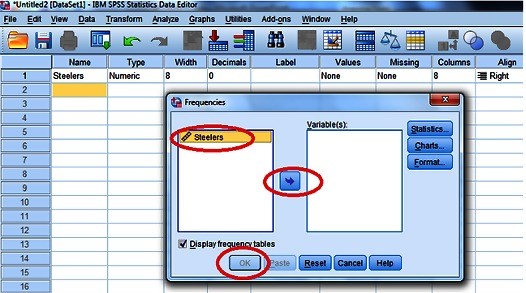
- Drag the variable to the ‘Variable’ column and hit ‘OK’
- Go to the ‘label’ and perform right-click, select ‘Edit Content’ > ‘ In Viewer’
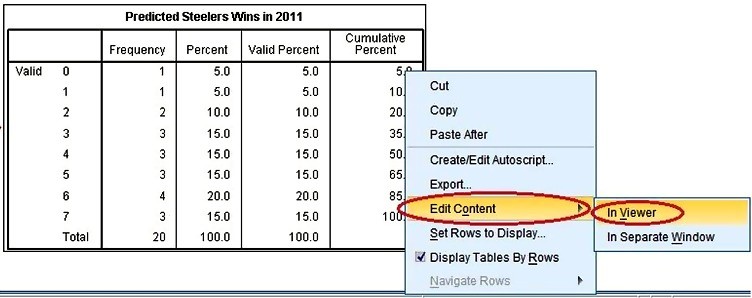
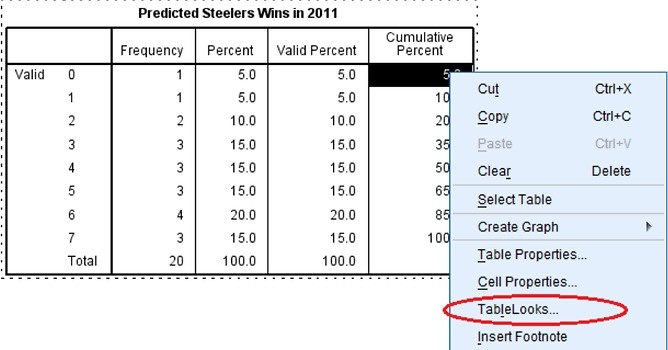
- Again perform right-click on the table and select ‘TableLooks’ (It’s a template that tells how SPSS format data table )
- Go to ‘Analyze’> ‘Descriptives’ > ‘frequencies’
- Create a new ‘TableLook’
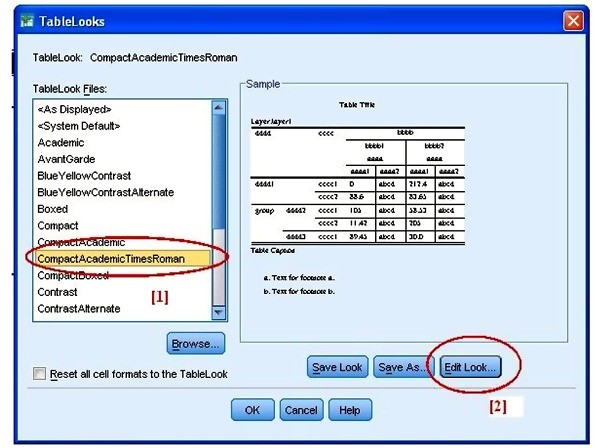
For creating a new Table Look:- From the list of ‘TableLook’ files, select ‘CompactAcademicTimesRoman’
- Hit Edit which will direct you to the “Table Properties” screen.
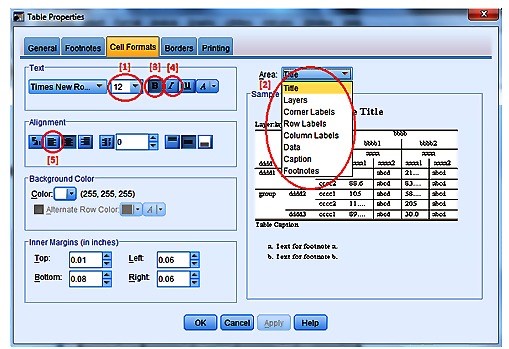
- Using the ‘Cell Formats’ tab, adjust the font to 12-point.
- Adjusting the font separately for each element from a drop down menu is a must.
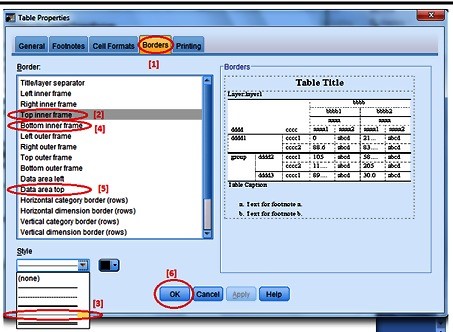
- In the ‘Table Properties’ window, switch to the ‘Borders’ tab.
- Keep holing down the ctrl key and select ‘Top Inner Frame’, ‘Bottom Inner Frame’ and ‘Data Area’, top in the border menu.
- Select the line style and click ‘OK’
Now coming back to the ‘TableLook’ window, click ‘Save As’ and then name the ‘Table’ and click ‘Save’
- Applying the TableLook:
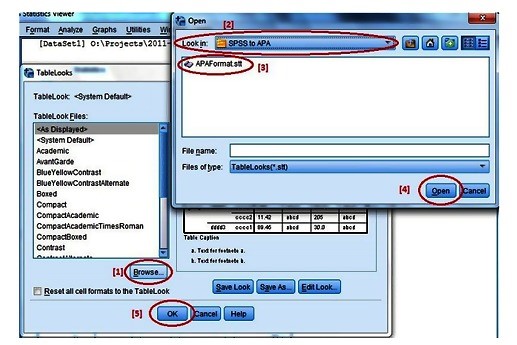
- Coming back to the SPSS-Statistics Data Viewer, In the TableLook window, click on the ‘Browse’ button and use the look in bar to select the saved TableLook.
- Click ‘Open’ and then hit ‘OK’ in the TableLook window.
-
-
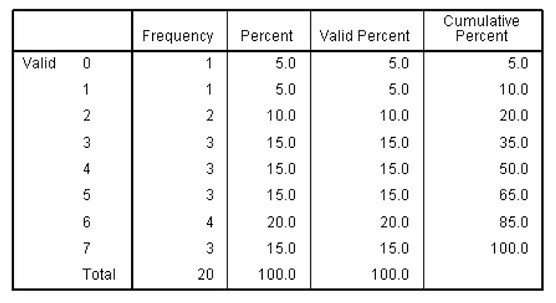
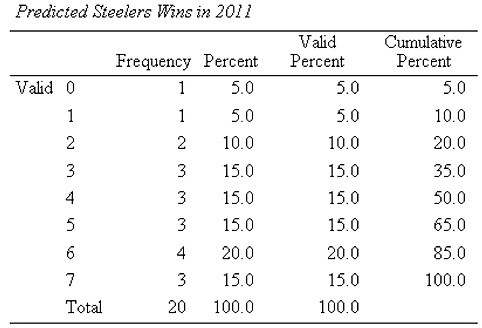
- And finally, you will get a table formatted in APA.
-
-
-
- Cheers to the SPSS, saved an extensive amount of time.
-
-
-
- For any query, reach us at
-
-