
Paired sample t-test
A paired sample t-test is used to compare two means where you have two samples in which observations in one sample can be paired with observations in the other sample. Instances, where this might occur, are:
- After and before observations on the same subjects (e.g. students’ symptomatic test results before and after an appropriate module or course).
- An association of two different methods of measurement or two different treatments where the computations/methods are applied to the same subjects.
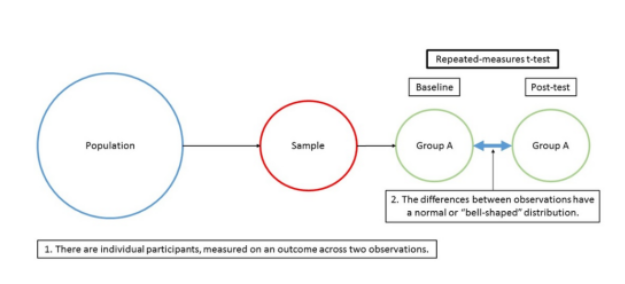
The flow depicts the use of a repeated-measures t-test. There is only one association being inspected at two within-subjects observations or two-time points for a continuous outcome. The assumption of normality of separation records has been met. A repeated-measures t-test is used to assess the change in a continuous outcome at two within-subjects observations or two-time points
ASSUMPTIONS:
The paired sample t-test makes some assumptions. Although t-tests are quite robust, it is a reliable practice to evaluate the degree of deviation from certain assumptions to estimate the essence of the results. The paired sample t-test has four assumptions:
- The dependent variable should be continuous (interval/ratio).
- The observations are independent of one another.
- The dependent variable should be normally distributed.
- There should be no notable outliers in the variances among the two related groups.
Level of Measurement
In paired sample t-test the sample data should be numeric and continuous, as it should be normally distributed. Continuous data can take on any value within a range . The contrast of constant data is discrete data, which can only take on a few value .Occasionally, discrete data can be used to approximate a continuous scale example likert scale.
Independence
Independence is usually not testable but can be reasonably assumed if the data collection process was random without replacement. Example, it is good enough to assume that the participating patients are independent of one another.
Normality
To test the presumption of normality, a variety of methods are available. Real-world data are rarely perfectly normal, so this assumption can be regarded as fairly met if the state looks nearly symmetric and bell-shaped.
Example
A group of Sports students (n = 20) is picked from the population to examine whether a 19-week preparation program improves its standing high jump performance. This method is used to test whether this training increases performance, the students are tested for their long jump performance before they begin a training program and then at the end of the programme (i.e., the dependent variable is “standing high jump performance”, and the two similar groups are the standing high jump values “before” and “after” the 19-week training program).
Test Procedure in SPSS Statistics
The six steps below explain to you how to analyze your data using a dependent t-test in SPSS Statistics Assumptions, should not be outraged. Following the six steps, the interpretation of the results is also commuted depending on the data analysis.
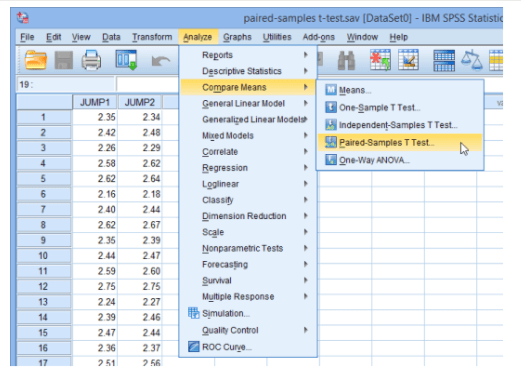
- Click Analyze
> Compare Means
> Paired-Samples T Test… on the top menu,
- You will be shown with the Paired-Samples T Test dialogue box, as explained here:
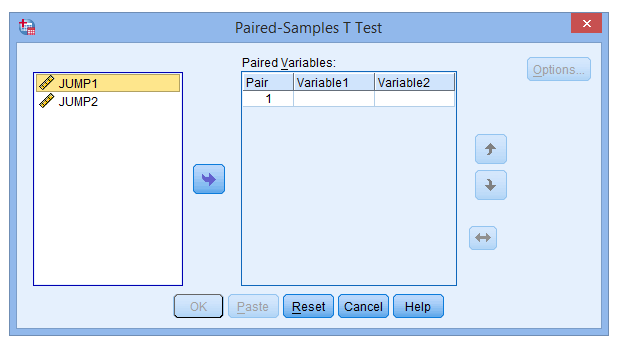
- Assign the variables JUMP1 and JUMP2 within the paired box. There are two methods to do this:
(1) click on both variables whilst bringing down the shift key and then pressing the button
(2) drag-and-drop each variable individually into the boxes.
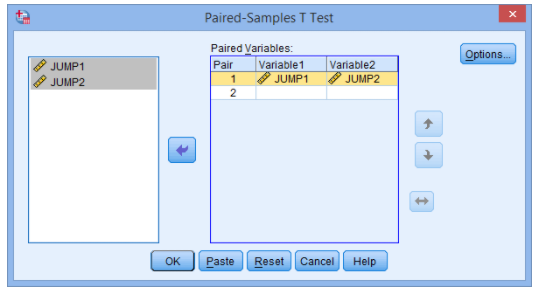
- If you want to adjust the confidence level limits or eliminate cases, click on the options button. After performing the Paired-Samples T-Test: Options dialogue box, as explained here:
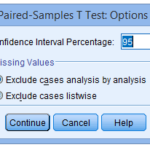
5.Click the continue button. You will be returned to the Paired-Samples T Test dialogue box
6.Click the OK button.
INTERPRETATIONS:
PSS Statistics generates three tables in the Output Viewer under the title “T-Test”,look at two tables: the Paired Samples Statistics table and the Paired Samples Test table.
Paired Sample Statistics Table
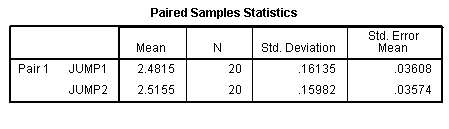
The initial table, titled Paired Samples Statistics, is where SPSS Statistics has generated detailed statistics for your variables. You could use the results here to describe the features of the first and second jumps in the write up
Paired Samples Test Table
The Paired Samples Test table is wherever the results of the dependent t-test are presented. A lot of information is displayed here and it is essential to identify that this information refers to the variations between the two jumps. 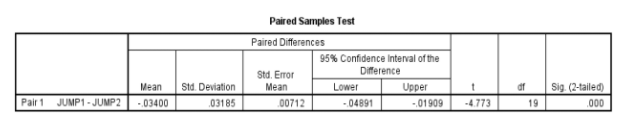
When drafting up the results of your t-test you need to report whether or not the test was significant developing this formula:
t (df) = t value,
p = p-value
For this particular example, we have found that the t-test is significant as the p-value is less than 0.05.
Results : t(19) = -4.773, p < 0.001
When interpreting we need to use information from both descriptive and inferential statistics in your output.
1: State the pattern of your data using the means and standard deviations from the first output table.
Results showed participants made a larger amount of ‘JUMP2’ (mean=2.51 , SD = 1.61) than for JUMP1 (mean = 2.48, SD = 0.159).
2: Report whether or not this difference is significant: A repeated-measures t-test found this difference to be significant,
t(19) = -4.773, p < 0.001. ·
3: Finally, you need to put this information together to understand and compile what we have found in terms of your hypothesis. therefore, we can reject the null hypothesis and accept the alternative hypothesis.